Geographic Information System (GIS) is the English term for Hệ thống thông tin địa lý. GIS refers to a set of computer-based methods used to collect and capture spatial data, organize it into databases, and perform functions such as management, retrieval, analysis, integration, visualization, and data sharing. In simple terms, GIS is a system that allows users to view and analyze data together with its geographic location information.
GIS originated from the Canada Geographic Information System, developed in Canada in the 1960s to manage land resources. Its creator, Roger Tomlinson, is widely regarded as the “father of GIS.” Initially, GIS was mainly used for practical applications. However, from the 1980s onward, GIS evolved into an academic research field, with the establishment of specialized journals and research centers. In Japan, the Great Hanshin-Awaji Earthquake in 1995 further accelerated GIS development, as scientists used the technology to assess damage and support disaster relief operations.
A familiar example of GIS is Google Maps. Through this application, users can locate a restaurant and view its opening hours on a map, search for routes to reach it, and check real-time traffic congestion information.
Learn more: Optimizing BIM Projects with GIS.
When talking about GIS, its first and most obvious function is to display geographic information on a map.
For example, if you want to find the location of a convenience store, searching only by address can sometimes be difficult. Displaying the information through GIS helps users understand the location more easily and find it much faster.

When sea surface temperature data is displayed using GIS, it can generate heat maps that make it easy to identify warm and cold water regions as well as areas with sudden temperature changes. From this, we can infer phenomena such as ocean currents, regions where marine life concentrates, and even predict extreme weather events.
In GIS, multiple layers of data can be overlaid based on location information, creating a multi-layered map. This allows users to analyze complex relationships between different geographic factors.

Example: By overlaying data on the locations of convenience stores with population data layers, we can visualize the density of convenience stores per population unit. This information is very useful for planning new store locations, identifying areas with high demand, and evaluating competitive effectiveness.
Visualizing data on maps not only helps us better understand the relationships between geographic factors but also enables deeper analytical capabilities.
One of the most common analytical techniques in GIS is buffering. A buffer is an area created around a geographic feature (such as a point, line, or polygon) at a specified distance.
Example: We can create buffers around schools to identify residential areas within a 1-km radius. This helps evaluate students’ accessibility to schools and identify suitable locations for developing other public facilities.

Learn more: The Value of BIM, Digital Twins, and Geospatial Technology: A Powerful Trio for the Comprehensive Lifecycle Management of Buildings and Infrastructure.
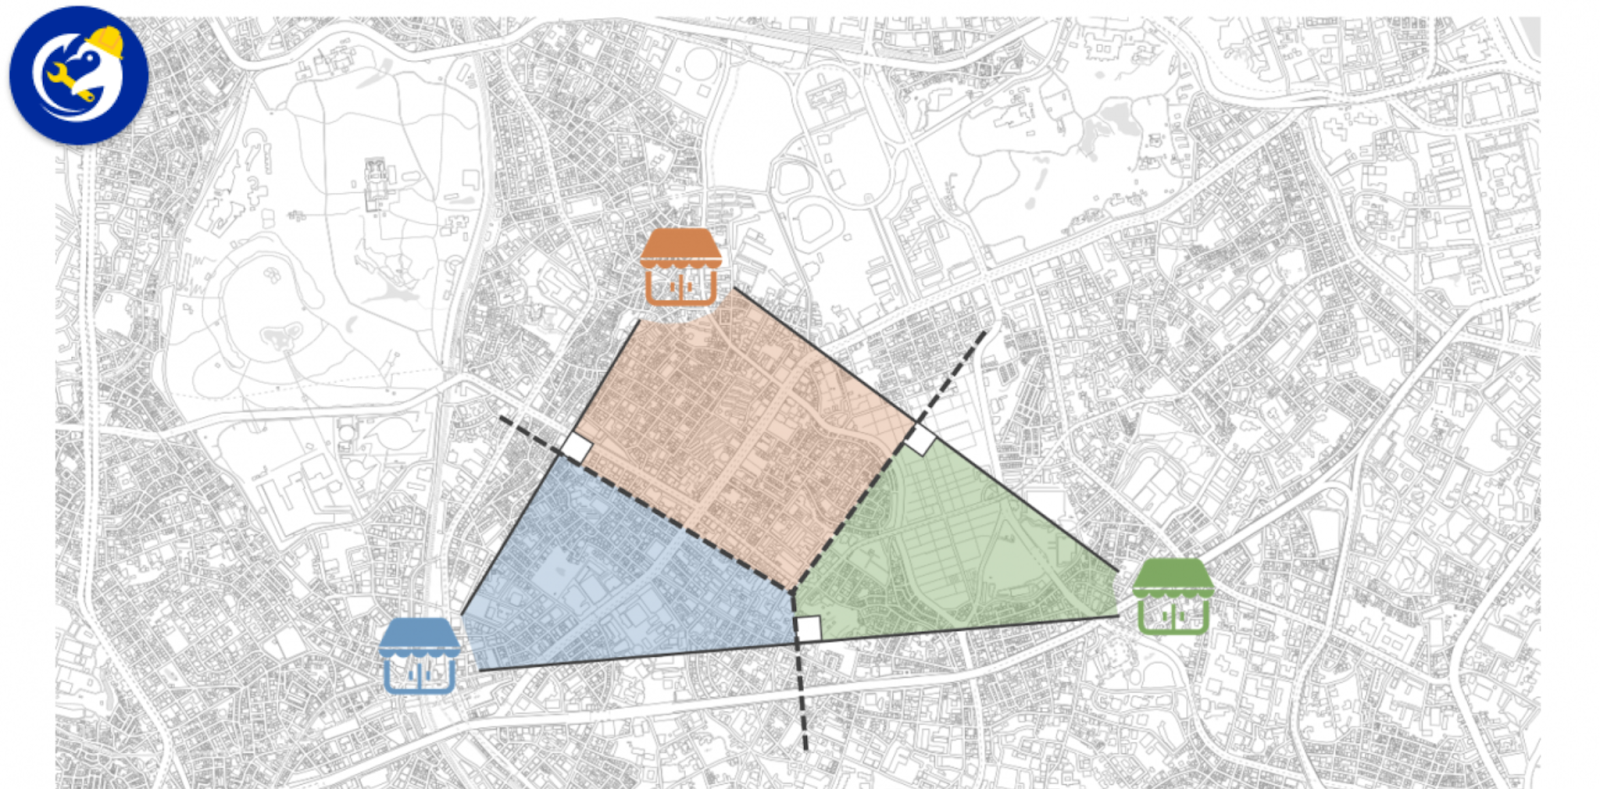
This method divides a space into regions, where each region is associated with a specific data point (for example, a school or a bus station). Every location within a region is closer to its corresponding data point than to any other point.
The division can be created by connecting the main points with straight lines and then constructing perpendicular bisectors to form the boundaries between regions. In practice, this method can also be combined with population accessibility analysis to develop more appropriate facility planning models.
Kernel Density Estimation (KDE) is a statistical method used to estimate the likelihood of an event occurring at different locations on a map based on known points where the event has already occurred.
For example, when crime incident points are visualized on a map and KDE is applied, it becomes possible to predict areas with a high density of crime events. In the healthcare sector, creating disease distribution maps based on the locations of reported cases is another common application.
Kernel Density Estimation is a statistical technique used to estimate the probability density function of a random variable from a finite sample of data (in this case, the locations of crime incidents).

Network analysis is a familiar tool in modern life that helps us find the shortest path or choose the most optimal route. It can be imagined as a map where cities represent nodes and roads represent the connections between them. Graph theory, the mathematical foundation of network analysis, allows us to model and analyze these complex systems effectively.
In GIS, road intersections are represented as nodes, while road segments are edges (links). These links can include attributes such as distance, travel time, or congestion levels, enabling the system to calculate and identify the shortest or most efficient route.
3D scene visualization reconstructs the view from a specific location by combining elevation data with information about surrounding features such as forests, fields, residential areas, and other objects.
Example: When planning the development of a residential area, it is important to review and understand the surrounding environment. A 3D scene visualization helps planners analyze nearby terrain and landscape conditions more clearly.
GIS has become an indispensable tool in many areas of modern life, from urban planning to natural resource management. Its ability to visually display geographic information, analyze relationships between spatial factors, and predict future trends has made GIS an important tool for addressing social and economic challenges.
Are you experiencing difficulties implementing BIM in your project? Do you need support to optimize your BIM workflows? Or are you looking to enhance your knowledge of BIM and related technologies?
Don’t worry — BIMCAD Vietnam is always ready to support you!